• Products
    • Sage Intelligence Reporting
      • Enrolment
    • Velixo
      • Enrolment
        • Velixo for Acumatica
        • Velixo for Sage Intacct
  • Services
    • Consulting
    • Training
    • Development
  • Support
    • Support Overview
    • Create Support Ticket
    • Book A Session
    • Knowledgebase
  • About
    • About Us
  • Contact
  • Products
    • Sage Intelligence Reporting
      • Enrolment
    • Velixo
      • Enrolment
        • Velixo for Acumatica
        • Velixo for Sage Intacct
  • Services
    • Consulting
    • Training
    • Development
  • Support
    • Support Overview
    • Create Support Ticket
    • Book A Session
    • Knowledgebase
  • About
    • About Us
  • Contact
Quick Support
Book Demo

How to format a chart in Excel to dynamically show its maximum value

By admin on February 15, 2019April 19, 2019

Data visualisation is fast becoming the norm for effective business intelligence. Having visuals that tell the right story at a glance go a long way in achieving this. Microsoft® Excel® provides you with a multitude of ways to enhance the visuals that you create. In this tip, I’ll show you how to format a basic bar chart to dynamically highlight the maximum value in the series.

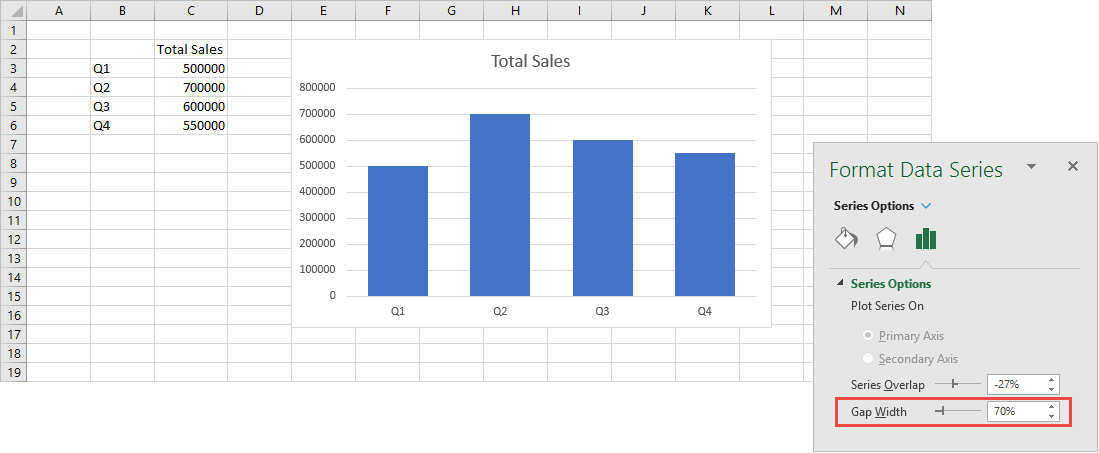
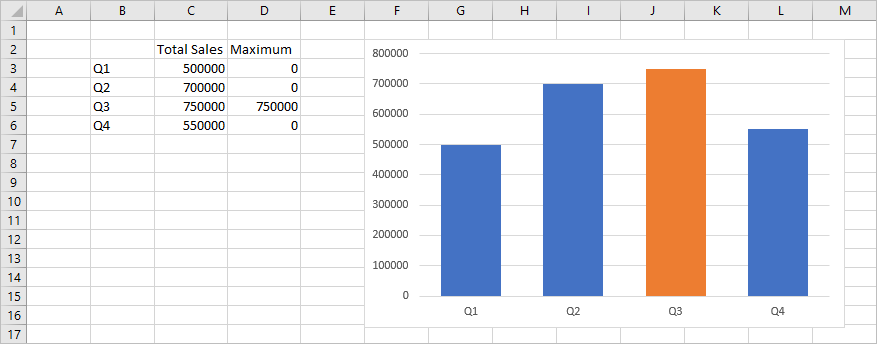
  1. I have a data series showing total sales values for each quarter in my financial year. I’ve created a basic bar chart to display this and I’ve widened each bar in the chart for greater emphasis. You can achieve this by decreasing the bar gap width under the Format Data Series options. To get to these options, right click on a bar and select Format Data Series.

Format Data Series Options

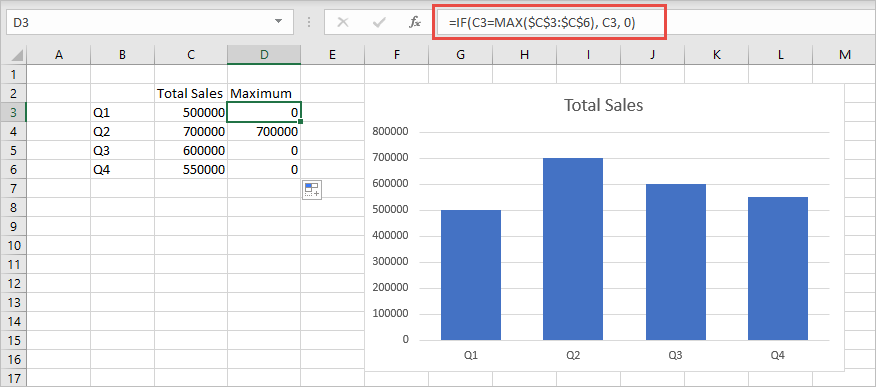
  1. To determine the maximum value, I’m going to add another series to the chart which I’ll define in the column to the right of my total sales. This column uses an IF and MAX function to return either the total sales value if it is the maximum or else zero. Use the formula displayed below.

IF/MAX formula


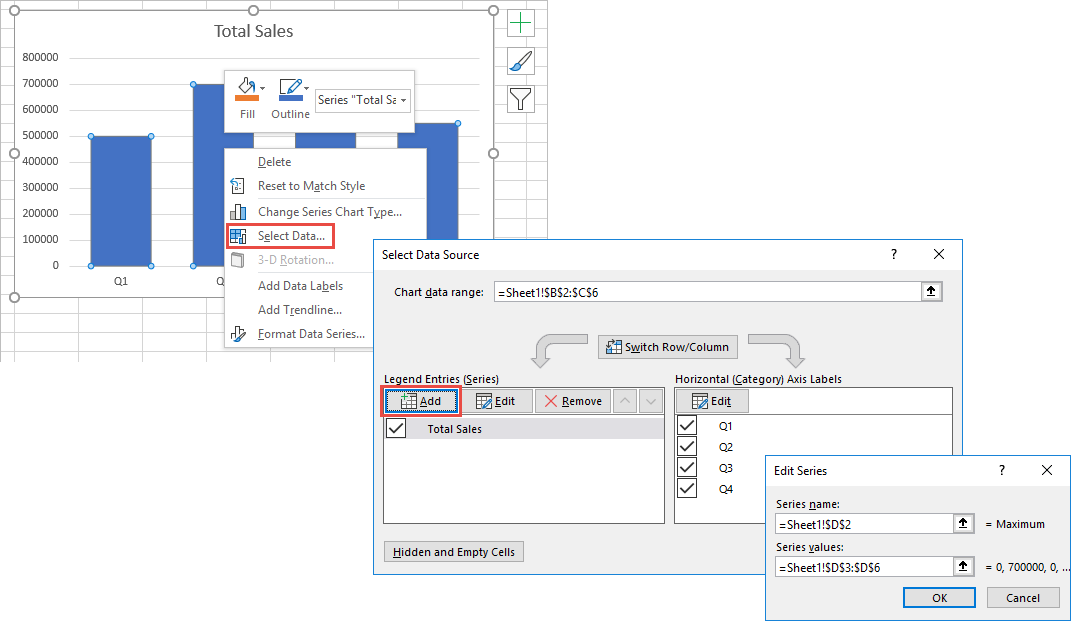
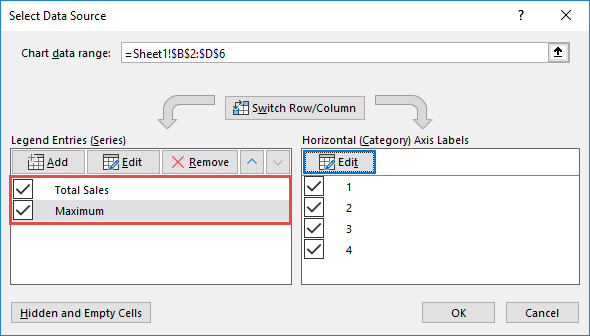
  1. I’m now going to add the new series to the chart. You can do this by right clicking on the chart and choosing Select Data > Select Add from the Select Data Source dialogue, and then pick the right cells for your series name and series values.

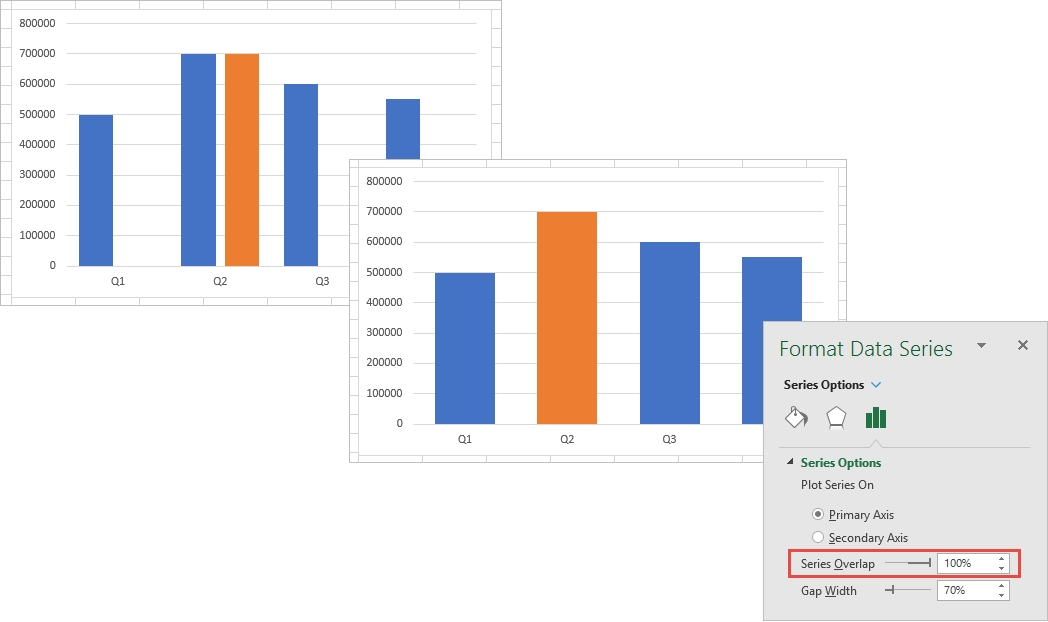
  1. The new series is now placed to the right of the existing series. To get it to appear in place of the existing series you need to overlap it.  You can do this by setting the Series Overlap amount in the chart properties to 100%.

Series Overlap Chart Options


Take note that as your series values change, the chart updates accordingly.

Chart Series Overlap


If the highlight isn’t displaying, go back to the Select Data Source dialogue and make sure that your highlight series is positioned after your main values series.

Select Data Source Options


As mentioned, Excel provides a multitude of ways for you to enhance your visuals.  It’s up to you to explore the possibilities.

The post How to format a chart in Excel to dynamically show its maximum value appeared first on Sage Intelligence.

Source: Excel on Steroids

Post navigation

Velixo momentum continues with release of version 4, with new features such as GL Writeback, Budget…
Create your own reports and customize the way you view your data with Sage Intelligence

Leave a Reply Cancel reply

Your email address will not be published. Required fields are marked *

Recent Posts

  • Why Working In Excel Works
  • Alchemex Welcomes Velixo 6 For MYOB Advanced
  • Welcome to Velixo Reports Version 4.2
  • Part 3 of 3: Learn how to create a Management Pack in Sage 50cloud Intelligence
  • Part 3 of 3: Create and customize reports easily with the Financial Report Designer

Search

Contact Us

Phone: +61 2 9890 2339
Email: sales@alchemex.com.au
Address: PO Box 212, Deaken West, Canberra, Australia, 2600

Products

  • Intelligence Reporting
  • Velixo Reports

Services

  • Consulting
  • Training
  • Development

About

  • About Us
  • Partners
  • Blog

Support

  • New Ticket
  • Community (Coming Soon)
  • Knowledgebase

Phone: +61 2 9890 2339
Sales: sales@alchemex.com.au
Support: support@alchemex.com.au

Facebook-f Linkedin

© All rights reserved Alchemex Pty Ltd 2020

Made with ❤ by Unfazed Ltd