• Products
    • Sage Intelligence Reporting
      • Enrolment
    • Velixo
      • Enrolment
        • Velixo for Acumatica
        • Velixo for Sage Intacct
  • Services
    • Consulting
    • Training
    • Development
  • Support
    • Support Overview
    • Create Support Ticket
    • Book A Session
    • Knowledgebase
  • About
    • About Us
  • Contact
  • Products
    • Sage Intelligence Reporting
      • Enrolment
    • Velixo
      • Enrolment
        • Velixo for Acumatica
        • Velixo for Sage Intacct
  • Services
    • Consulting
    • Training
    • Development
  • Support
    • Support Overview
    • Create Support Ticket
    • Book A Session
    • Knowledgebase
  • About
    • About Us
  • Contact
Quick Support
Book Demo

How to add a variance and running total in a Pivot Table

By admin on August 1, 2018April 19, 2019

In our example workbook, we’re working with Date, Value In and Value Out fields. We need to create a Pivot Table that will also display the variance per month, as well as a running total of the variance for the year. In this tip, we show you how to do this.

First up; select your data and create a Pivot Table as normal.

To create the additional fields:

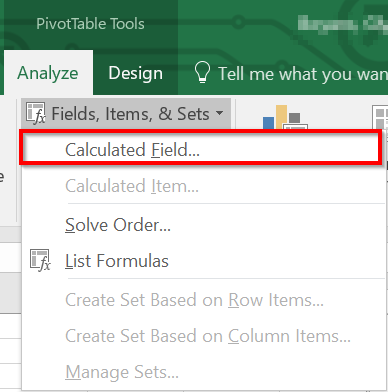
  1. Click inside the Pivot Table and select PivotTables Tools > Analyze > Fields, Items & Sets under the Calculations menu section.

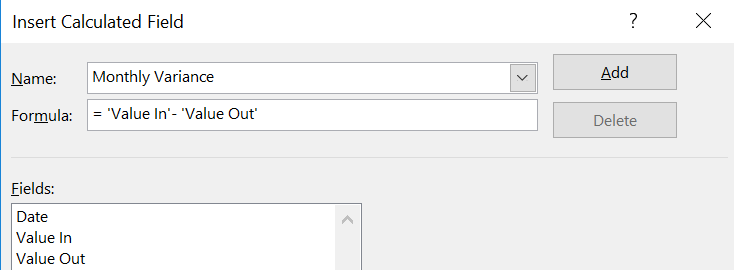
  1. An Insert Calculated Field window will pop-up. Give the field a name, enter your variance formula and select Add.  In our example we want to know the variance between our Value In and Value Out values.

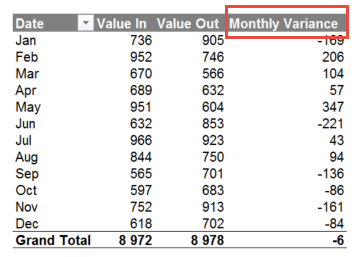
  1. This new field will display in your Pivot Table. You can now format the field as required

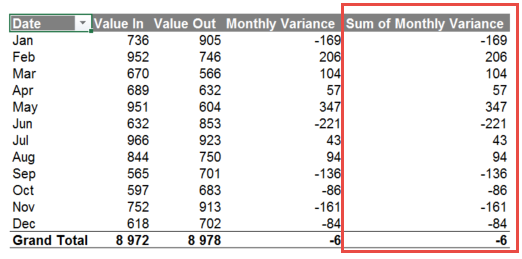
  1. To calculate a Running Total of the Variance field, drag the Monthly Variance field under the existing Monthly Variance field in the Value section of the PivotTable. You should now have a duplicate in your PivotTable, which can be renamed.

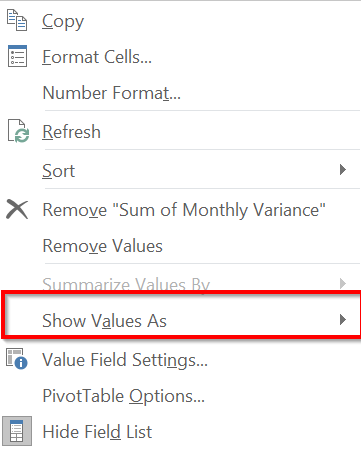
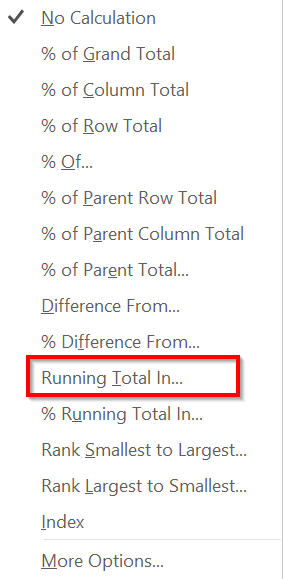
  1. Right click on any cell inside this column and from the menu, select Show Values As > Running Totals In”.


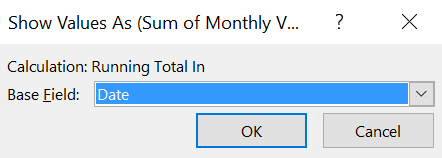
  1. Select OK if the default Base Field is correct.

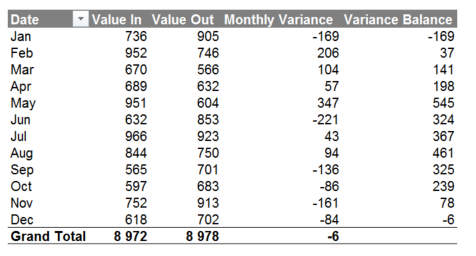
  1. The column has now been converted and your report displays the Variance per month as well as a Running Total for the year

And that’s it! A quick and easy way to create a Pivot Table that will also display the variance per month, as well as a running total of the variance for the year.

The post How to add a variance and running total in a Pivot Table appeared first on Sage Intelligence.

Source: Excel on Steroids

Post navigation

Learn how to use Column Variables for more descriptive headings in your cloud reports
Learn the various Report Manager menu ribbon functions

Leave a Reply Cancel reply

Your email address will not be published. Required fields are marked *

Recent Posts

  • Why Working In Excel Works
  • Alchemex Welcomes Velixo 6 For MYOB Advanced
  • Welcome to Velixo Reports Version 4.2
  • Part 3 of 3: Learn how to create a Management Pack in Sage 50cloud Intelligence
  • Part 3 of 3: Create and customize reports easily with the Financial Report Designer

Search

Contact Us

Phone: +61 2 9890 2339
Email: sales@alchemex.com.au
Address: PO Box 212, Deaken West, Canberra, Australia, 2600

Products

  • Intelligence Reporting
  • Velixo Reports

Services

  • Consulting
  • Training
  • Development

About

  • About Us
  • Partners
  • Blog

Support

  • New Ticket
  • Community (Coming Soon)
  • Knowledgebase

Phone: +61 2 9890 2339
Sales: sales@alchemex.com.au
Support: support@alchemex.com.au

Facebook-f Linkedin

© All rights reserved Alchemex Pty Ltd 2020

Made with ❤ by Unfazed Ltd